


Performance Profiling and Tuning
After developing a functional Legion application, it is usually necessary to profile and tune for performance. This page covers techniques to achieving high performance in Legion applications.
- Preliminary Steps
- Legion Prof
- (Deprecated) Legacy Profile Viewer
- General Optimization Techniques
- Legion Configuration:
Preliminary Steps
When performance is desired, always build Legion in release mode
(i.e. DEBUG=0 make). Release mode ensures that expensive assertions
and checks are disabled, and that appropriate optimization flags are
used in the build. Also, remember to remove any unnecessary build
flags (e.g. -DPRIVILEGE_CHECKS, -DBOUNDS_CHECKS, or -DLEGION_SPY).
Set OUTPUT_LEVEL at an appropriate level. The default (LEVEL_DEBUG)
is usually acceptable as dynamic checks are sufficient to ensure that the
extra logging statements are not a performance problem. However, a higher
level such as LEVEL_SPEW might cause problems, even when disabled on the
command-line.
If using GASNet, ensure that GASNet has been properly configured and optimized. GASNet can be important for performance on multi-node runs.
Legion Prof
Before taking steps towards optimizing a program, it usually helps to profile the application in question. Legion has a task-level profiler called Legion Prof which is used for this purpose.
Legion Prof is compiled into all builds by default, so no additional
compile-time flags are required. However, it is always recommended to
compile Legion in release mode (i.e. DEBUG=0) before measuring
performance.
Legion Prof outputs its logs in a compressed binary format using ZLIB.
If you don’t have ZLIB on your system, you can set USE_ZLIB=0 in
your Makefile.
Generating Legion Prof Logs
To profile an application, run with -lg:prof <N> where N is the
number of nodes to be profiled. (N can be less than the total number
of nodes—this profiles a subset of the nodes.) Use the
-lg:prof_logfile <logfile> flag to save the output from each node to
a separate file. The argument to the -lg:prof_logfile flag follows
the same format as for -logfile, except that a % (to be replaced
by the node number) is mandatory.
Once you have a set of logs, install the profile viewer application
legion_prof to view them, as described below.
Installing legion_prof
Logs generated by -lg:prof can be viewed with the legion_prof tool
included in the Legion repository. To install the tool, run the
following:
curl --proto '=https' --tlsv1.2 -sSf https://sh.rustup.rs | sh
cargo install --locked --all-features --path legion/tools/legion_prof_rs
The first line installs Rust. The second installs the legion_prof
binary into ~/.cargo/bin. The supported flags can be queried with
legion_prof --help.
IMPORTANT: When using legion_prof, it is critical that you
install it from the exact same version (or Git commit) of Legion that
the application was compiled against. Legion’s log format changes
periodically, and we do not promise backwards compatibility between
versions.
After installation, legion_prof provides four different modes for
viewing profiles, depending on what you’re trying to do.
Viewing Profiles Locally (View Mode)
legion_prof --view prof_*.gzIn this mode log files are parsed locally and a desktop UI is launched to view the profile.
Saving and Sharing Profiles (Archive Mode)
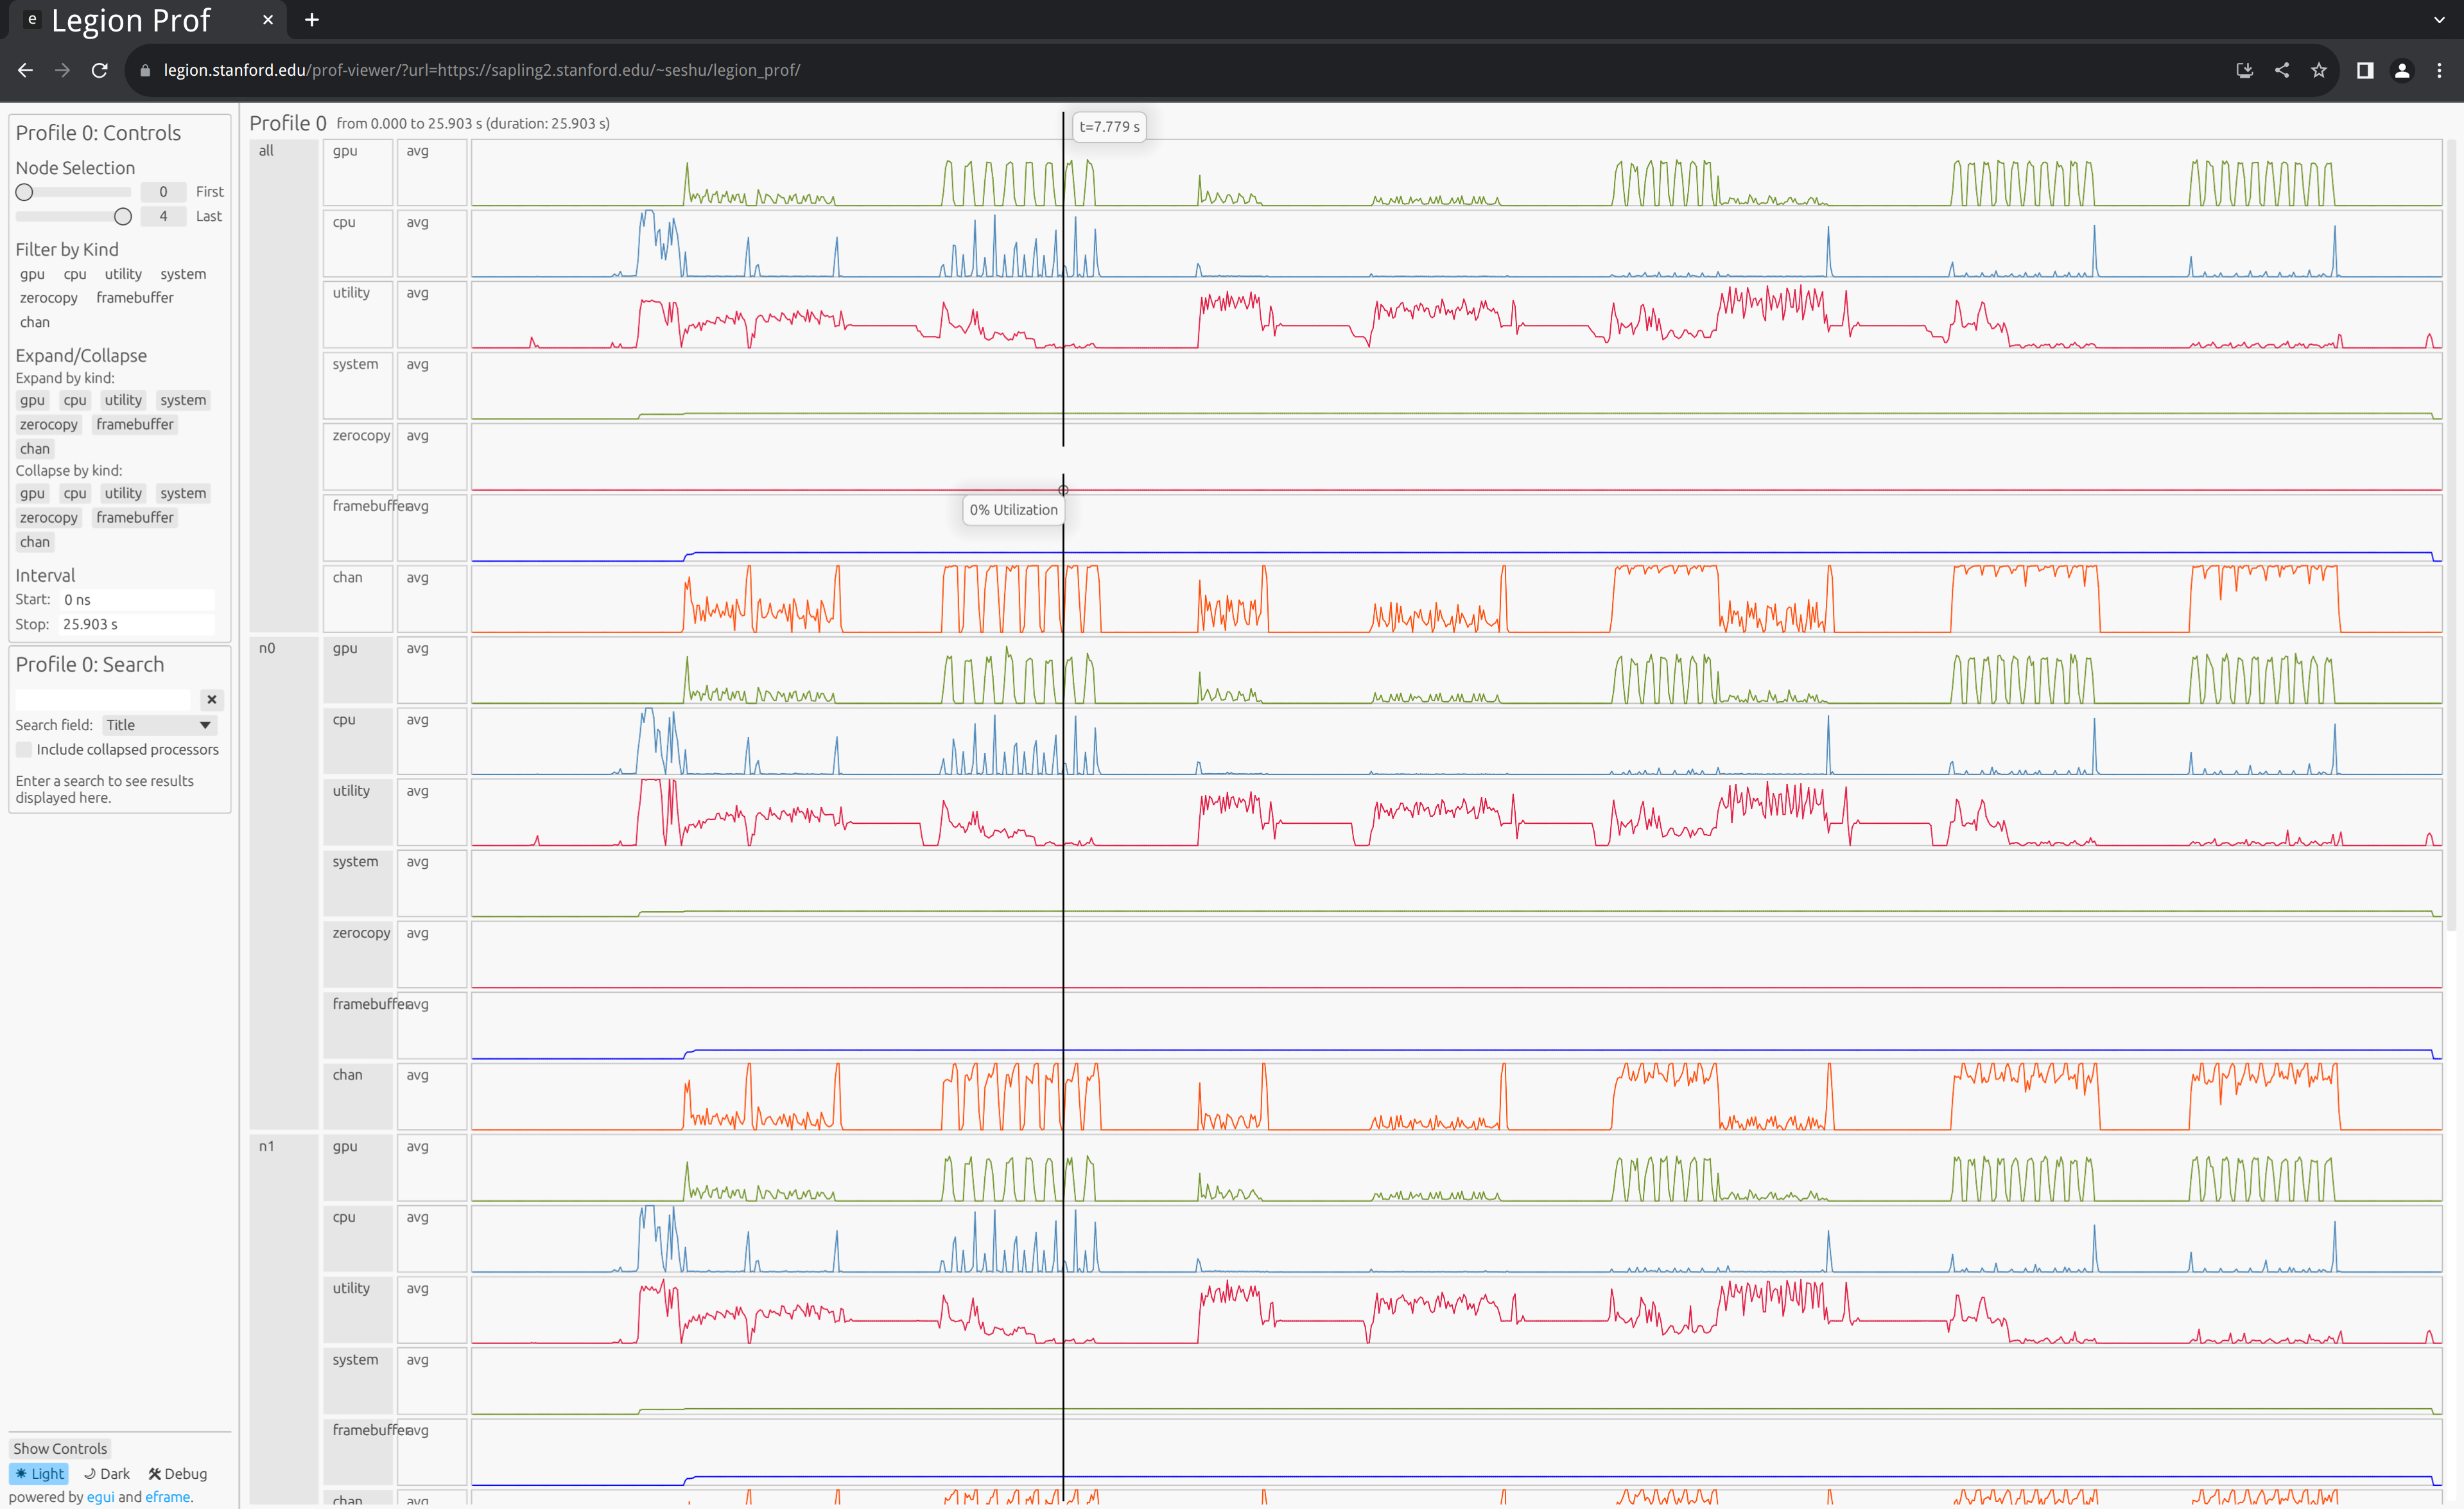
legion_prof --archive prof_*.gz -o legion_prof_archiveIn this mode log files are parsed locally but the profiler generates an archive (a directory containing processed profile files).
To view the archive, upload it to a publicly-visible web server and
open the URL:
https://legion.stanford.edu/prof-viewer/?url=https://<URL> where
<URL> is the location the archive was uploaded to. Note that it is
important that <URL> end with a /, because the archive is a
directory.
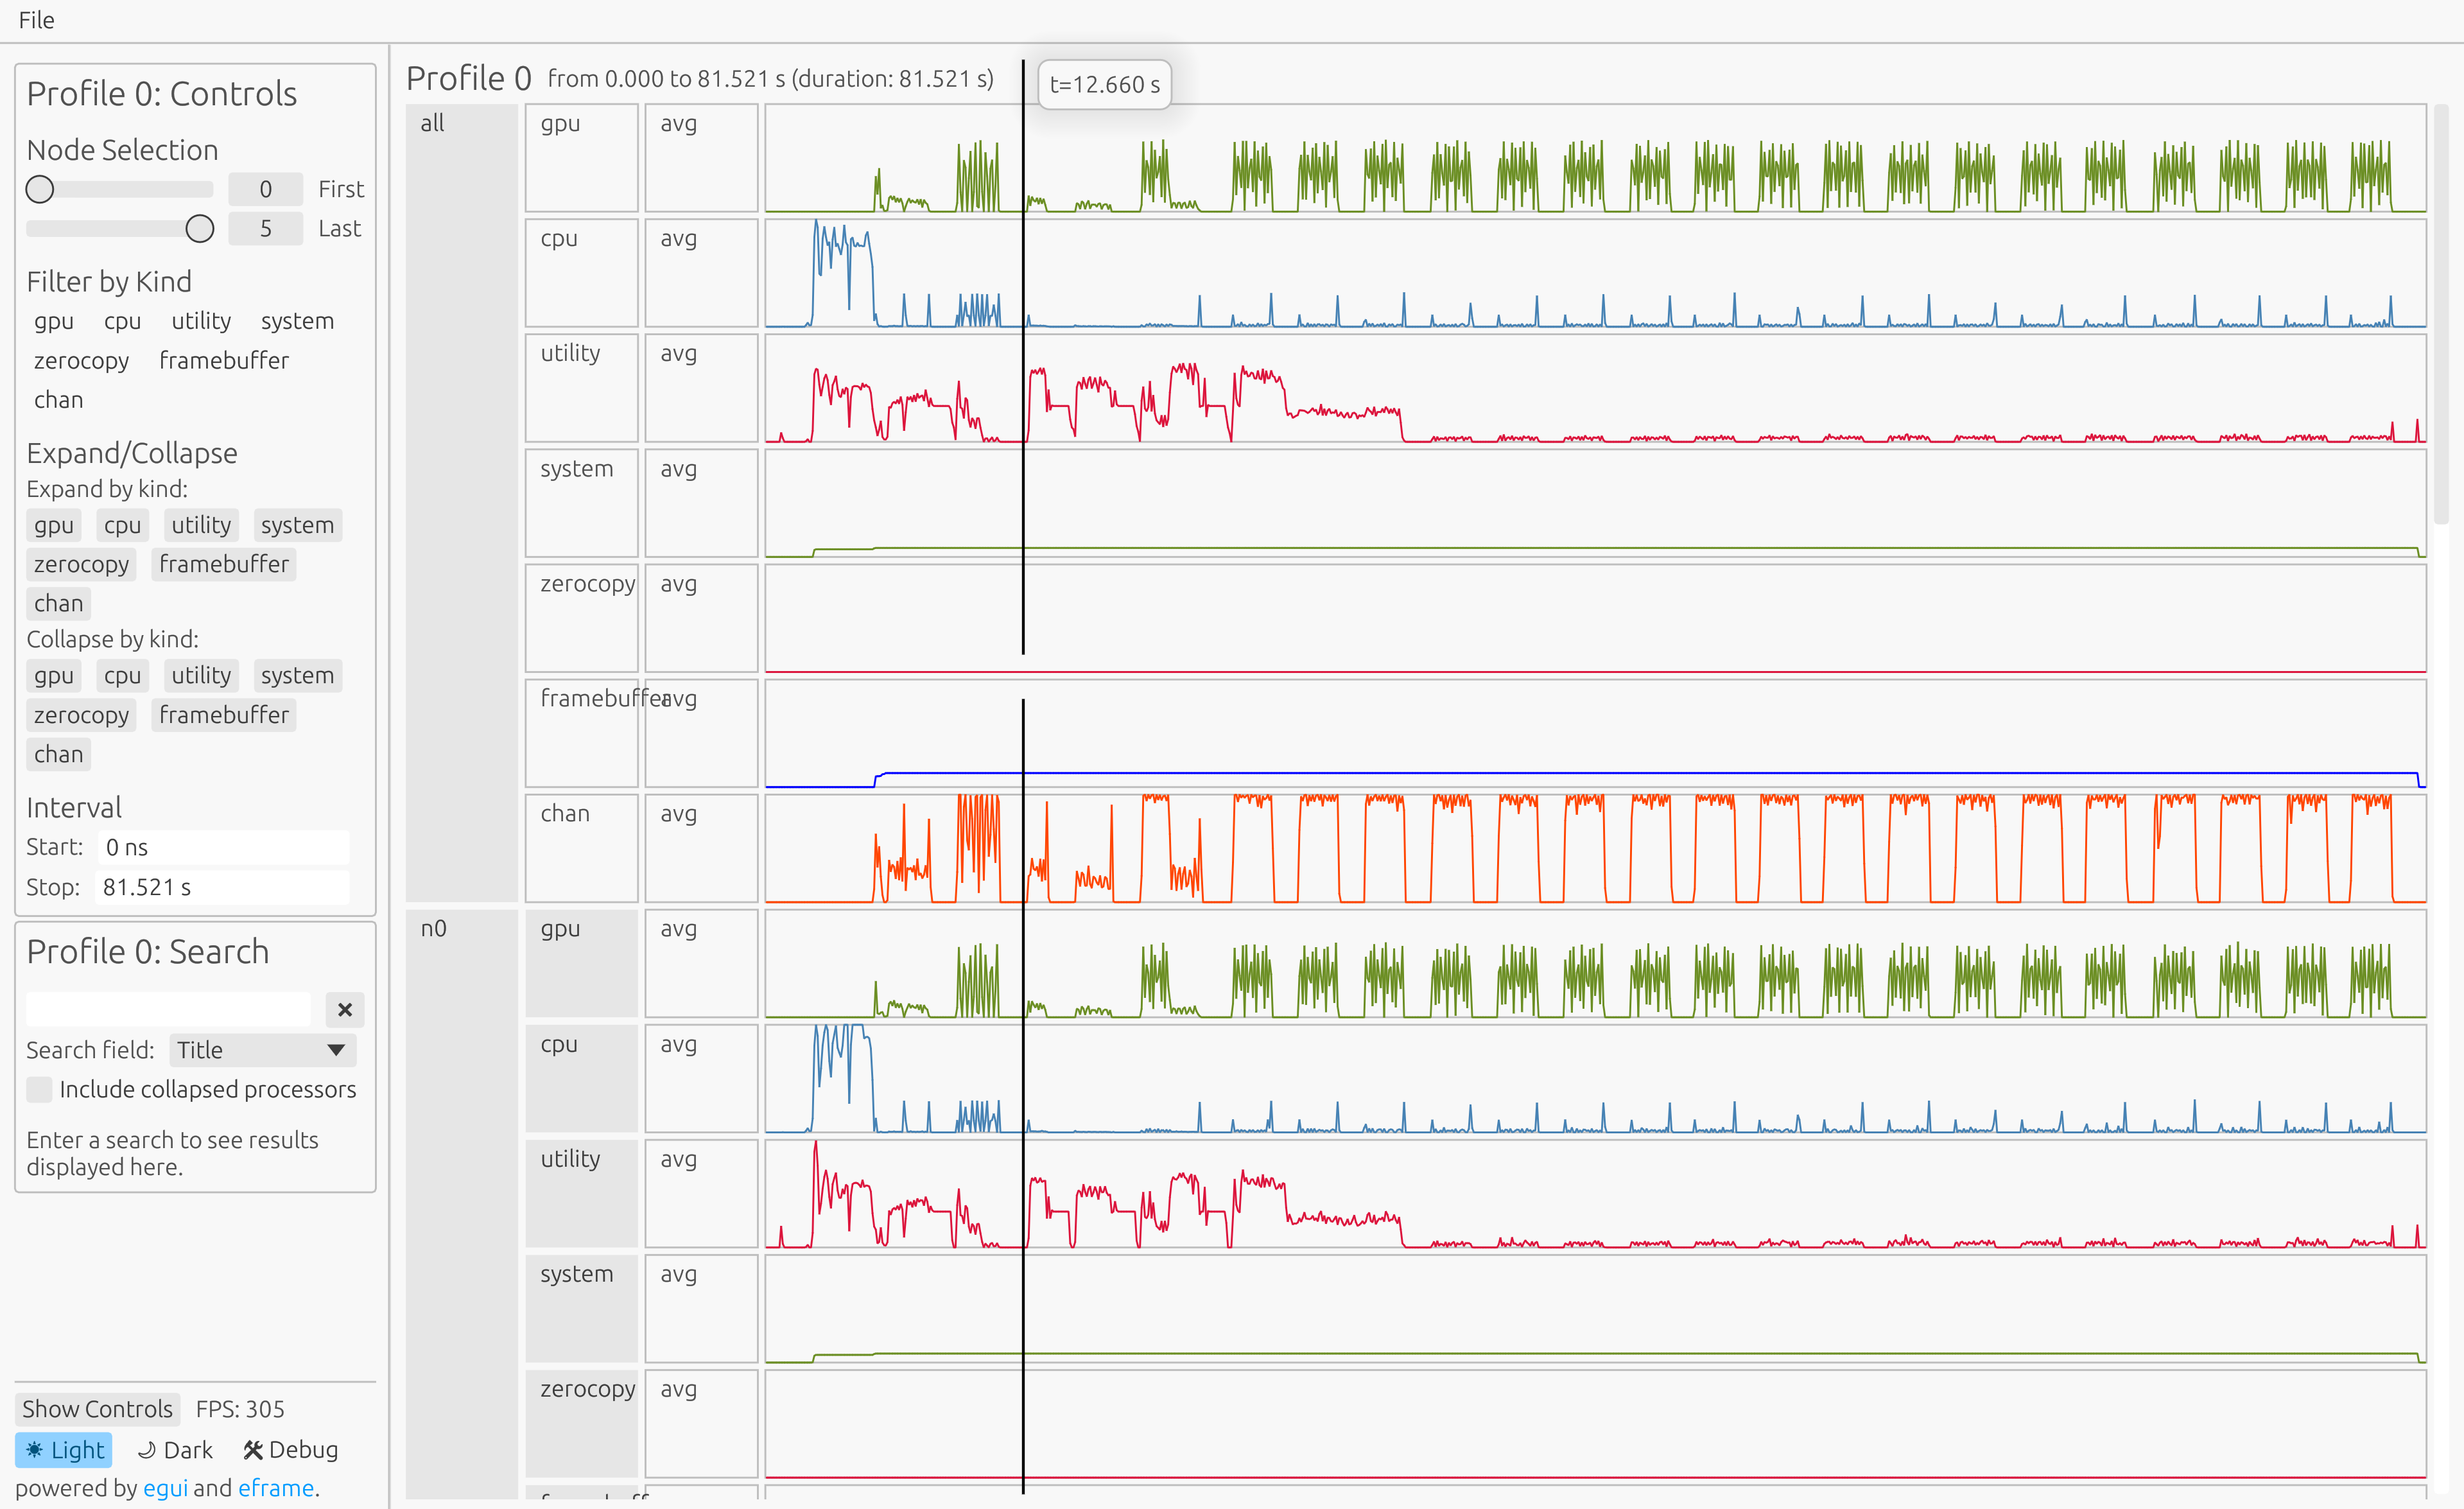
Remotely Viewing Profiles (Serve and Attach Modes)
legion_prof --serve prof_*.gzUsing this mode log files can be processed remotely on a machine with
more memory. legion_prof will start a web server and allow you to
attach using a local client. For example, if both client and server
are running on the same machine, you can do:
legion_prof --attach http://localhost:8080Typically, you’ll want to run the server on a different machine. In
this case, you can use SSH port forwarding to open a connection for
the viewer. Using sapling2.stanford.edu as an example host:
ssh -L 7999:localhost:7999 sapling2.stanford.edu
sapling2:~$ legion_prof --serve --port 7999 prof_*.gz
Then on your local machine run:
legion_prof --attach http://localhost:7999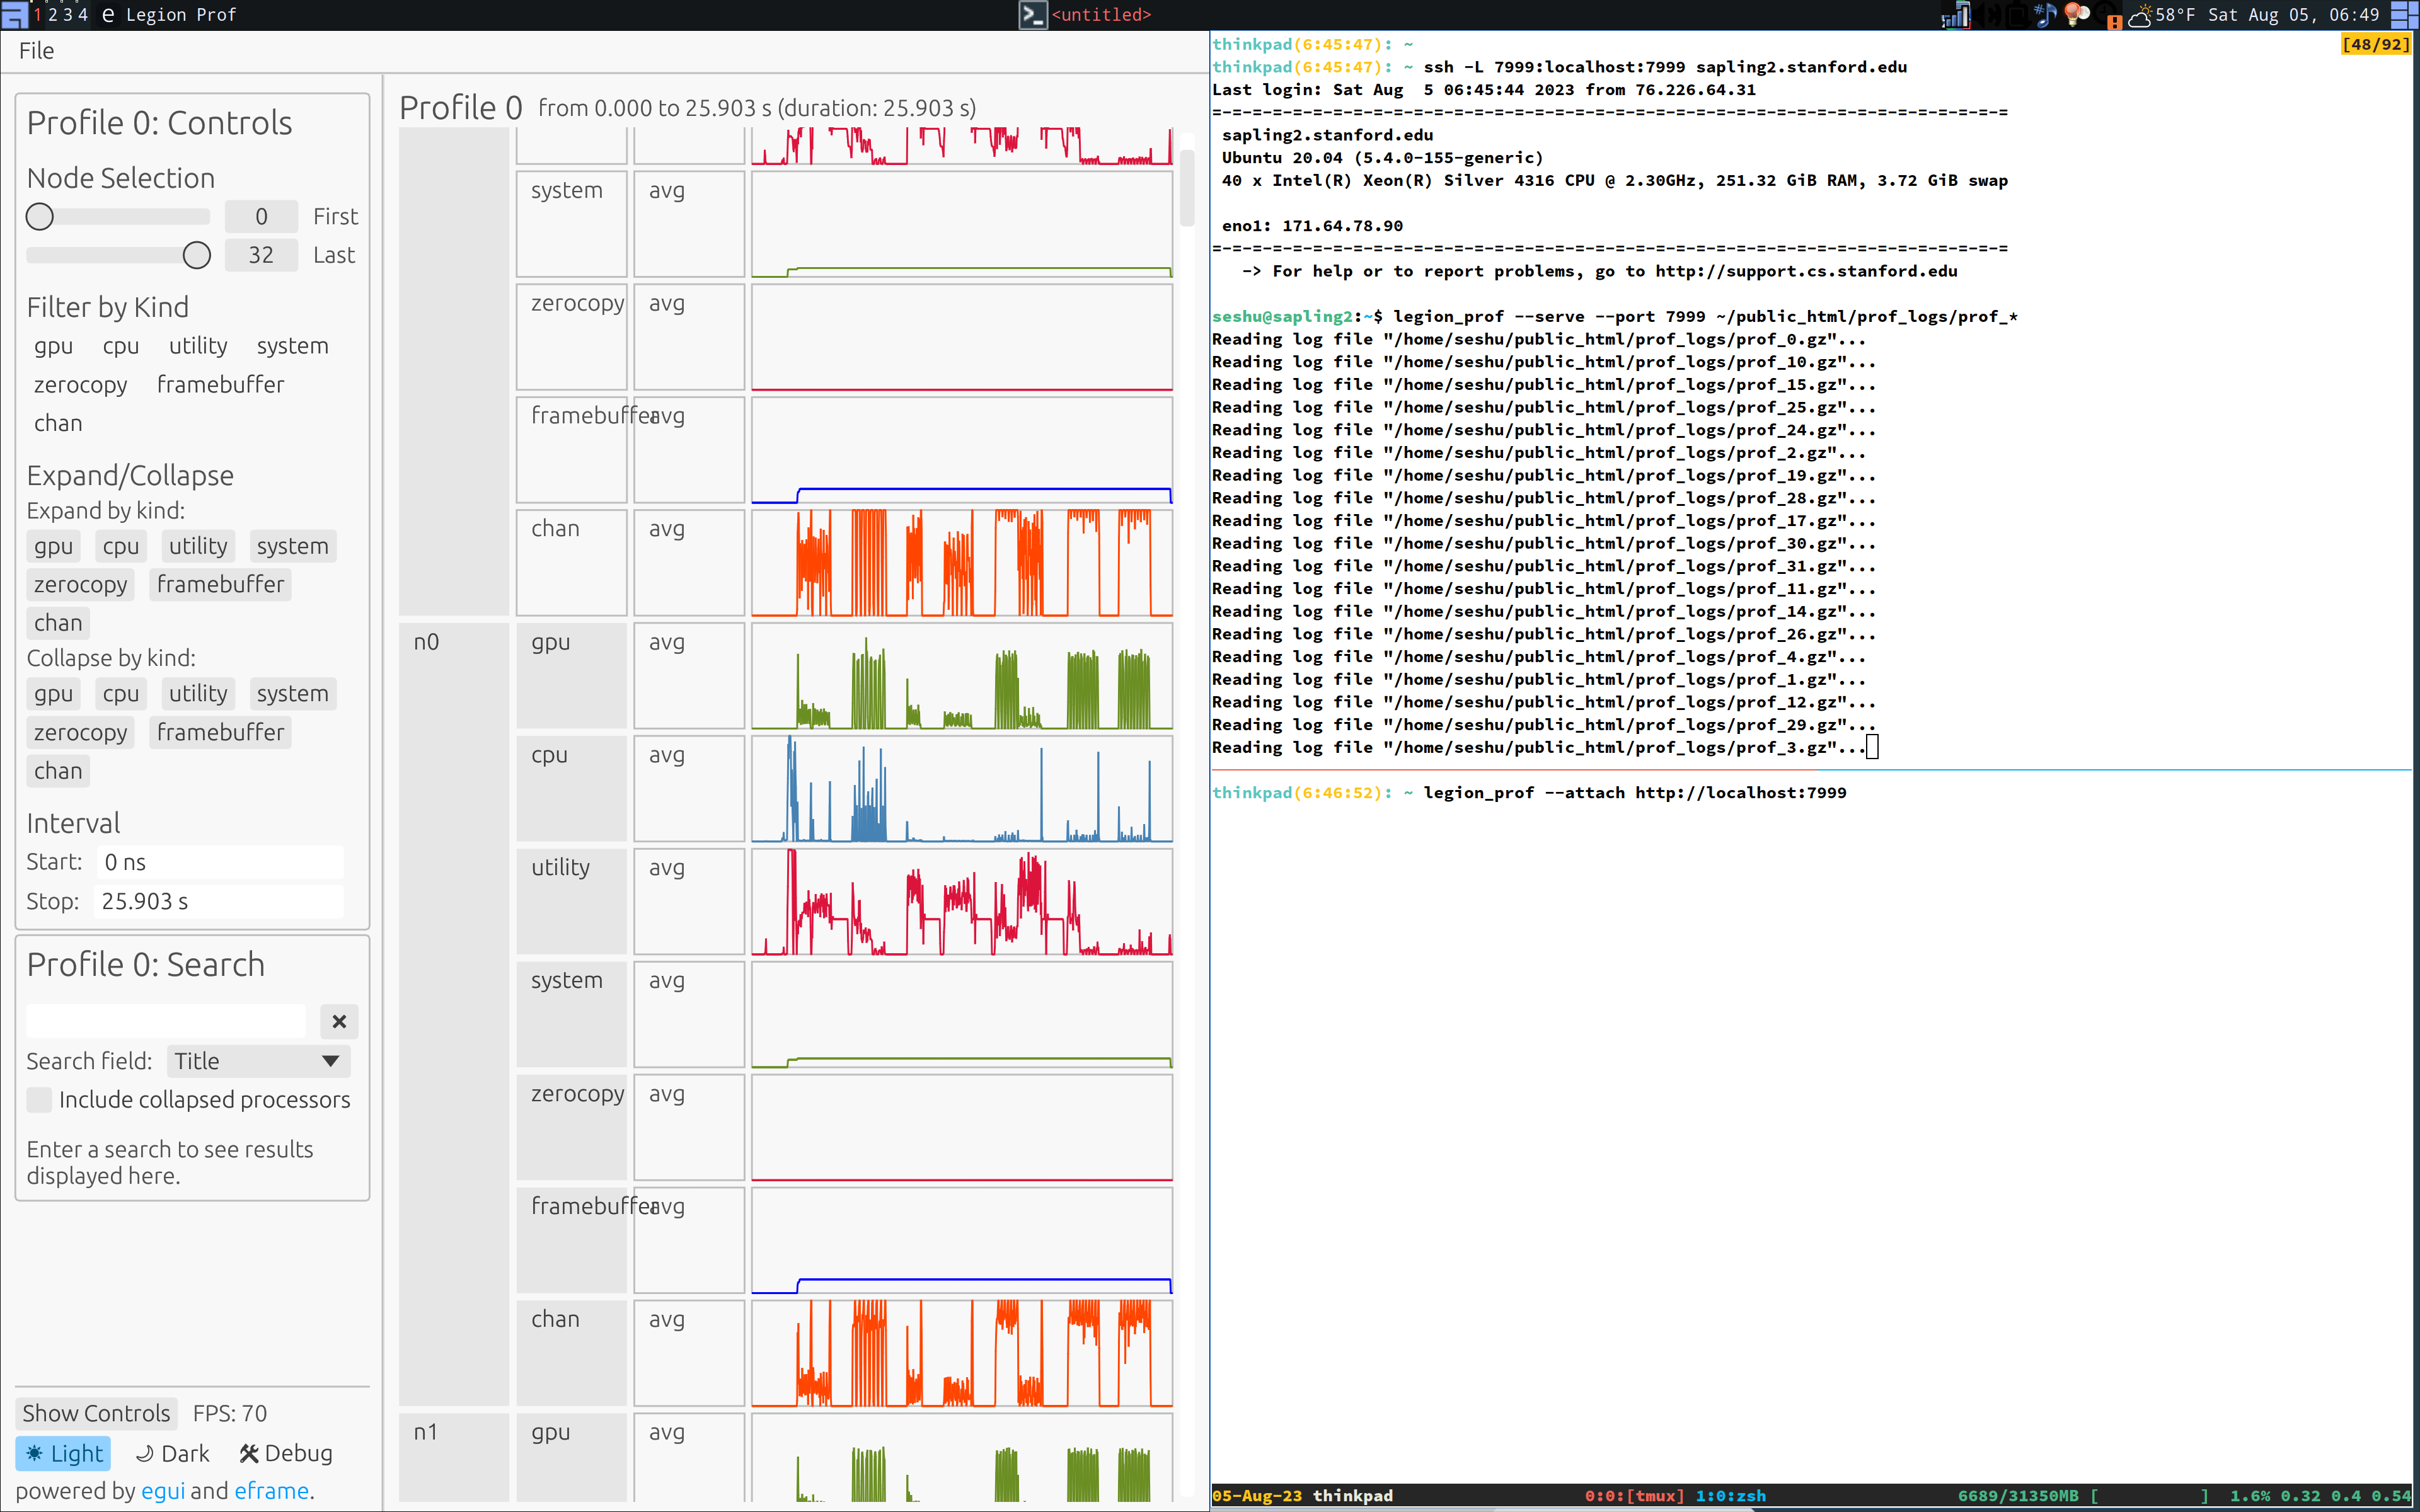
(Deprecated) Legacy Profile Viewer
The legion_prof program also provides a (deprecated) legacy
viewer. This viewer runs in a browser and is substantially slower; in
fact, larger profiles won’t load in the viewer at all. The new viewer
modes (shown above) are feature-complete in almost every respect,
leaving little reason to use this mode. However, if you would like to
use it, it is described below.
legion_prof prof_*.gzRunning the profiler in this mode produces a directory called
legion_prof in the current directory which contains an HTML file
that can be viewed in your browser by copying to the directory to a
web server or using a local web server as shown below:
cd legion_prof
python3 -m http.server
and loading the page on localhost:8000 from your browser.
Alternatively, if you want to use Chrome on local profiles, launch Chrome with
chrome --allow-file-access-from-files from the terminal. Note that you will
need to completely close Chrome before doing this.
A sample of Legion Prof’s output is shown below.
Interacting with a Profile
The default view of the profile only shows overall utilization figures
to display a broad overview of the performance of the application.
However, after clicking on the triangles on the left had side of the screen,
the profile can display more detailed information. This will uncollapse the
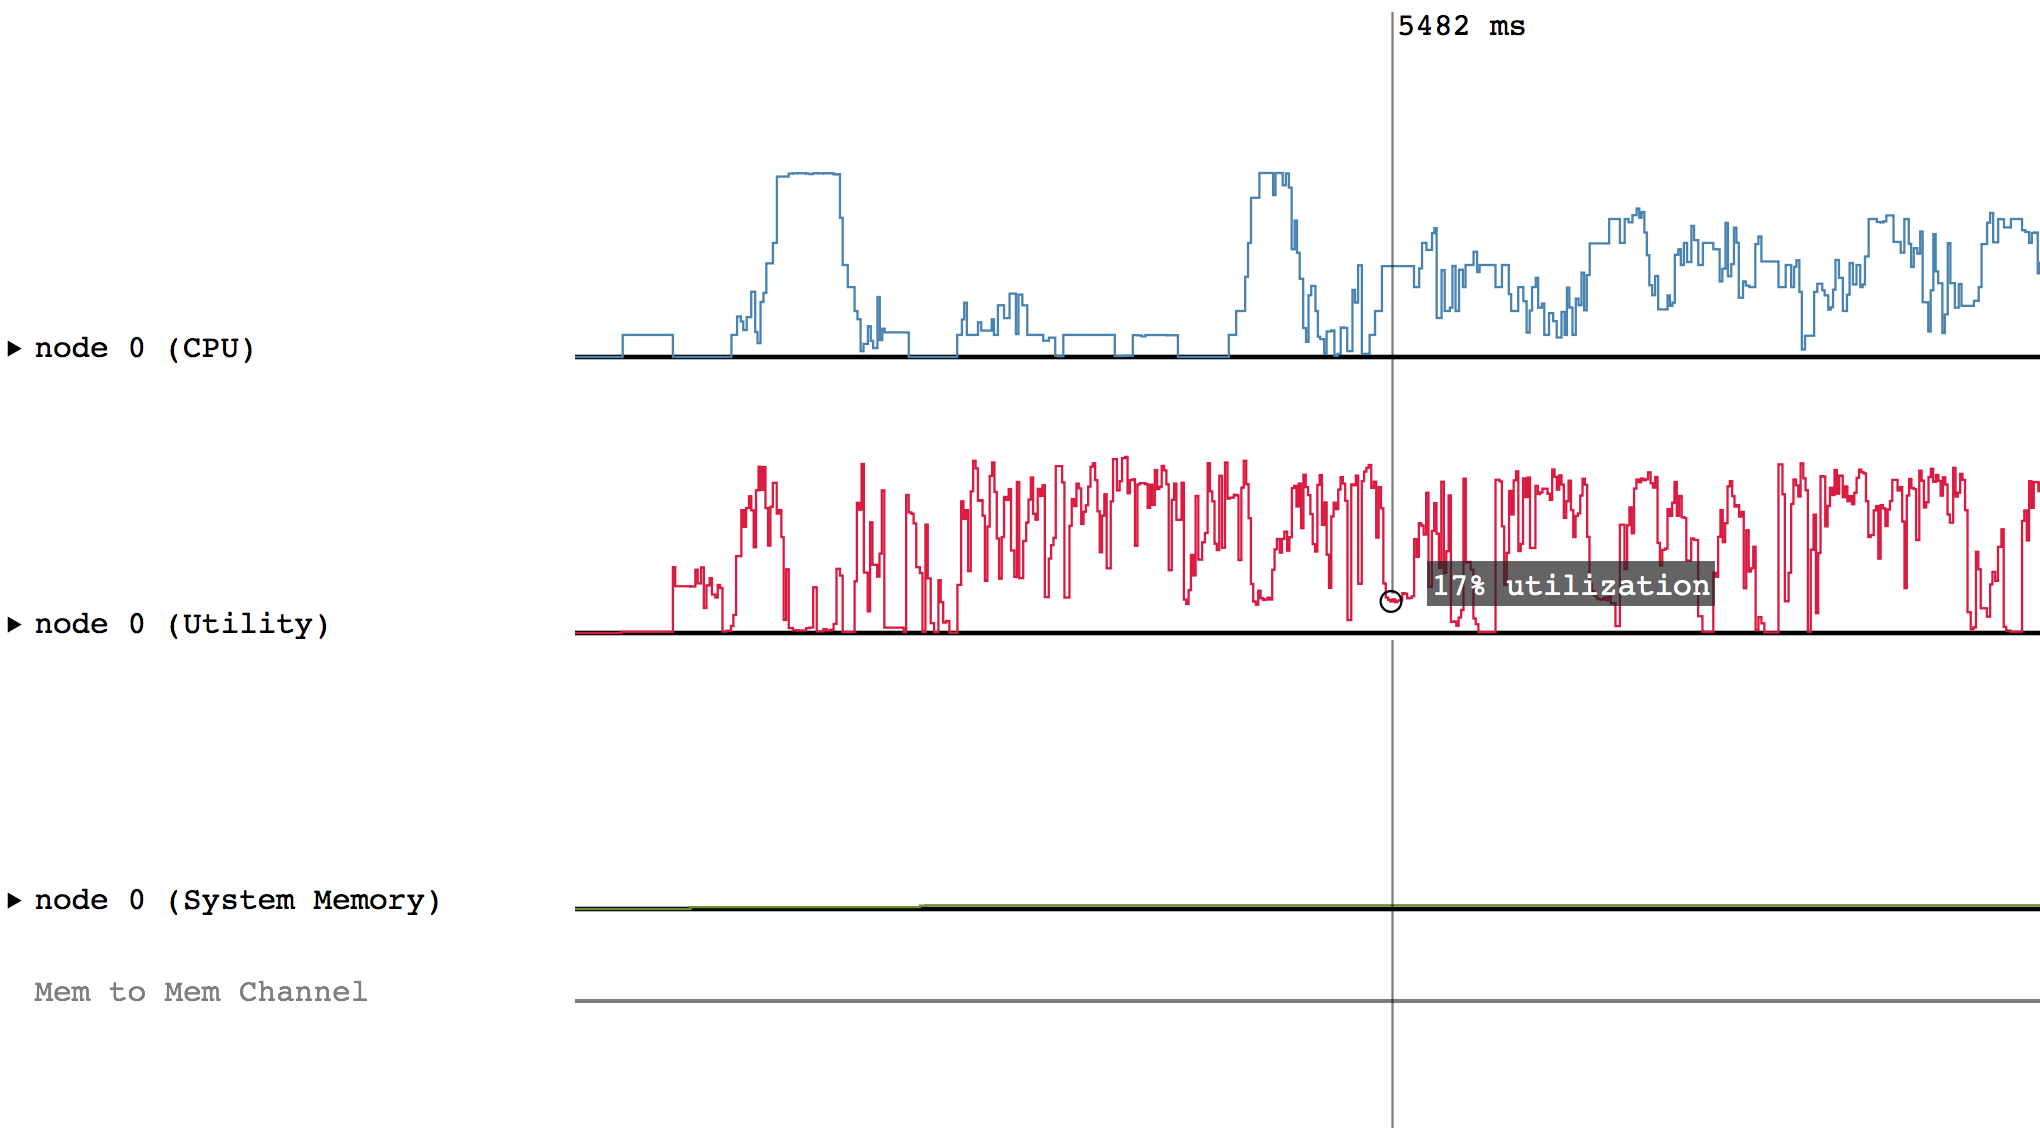
corresponding line to show the actual events that happened during the application.
For example, after clicking on the triangle for node 0 (CPU):
Hovering over a box in this more detailed view will display relevant information such as the name of the task, the start and end time, and the total duration of the task. The color of the box will be lighter if the task was waiting or ready to be scheduled, but was not actually executing.
Some of the boxes in the profile are gray. These are groups of tasks that are too small to be viewed at the current zoom level. To zoom in, click and drag the mouse over a region of interest.
After zooming in on a section, you can return to the previous zoom level by
pressing u on the keyboard. You can also reset the zoom level by pressing 0.
For other options, use the ? key to show a help message.
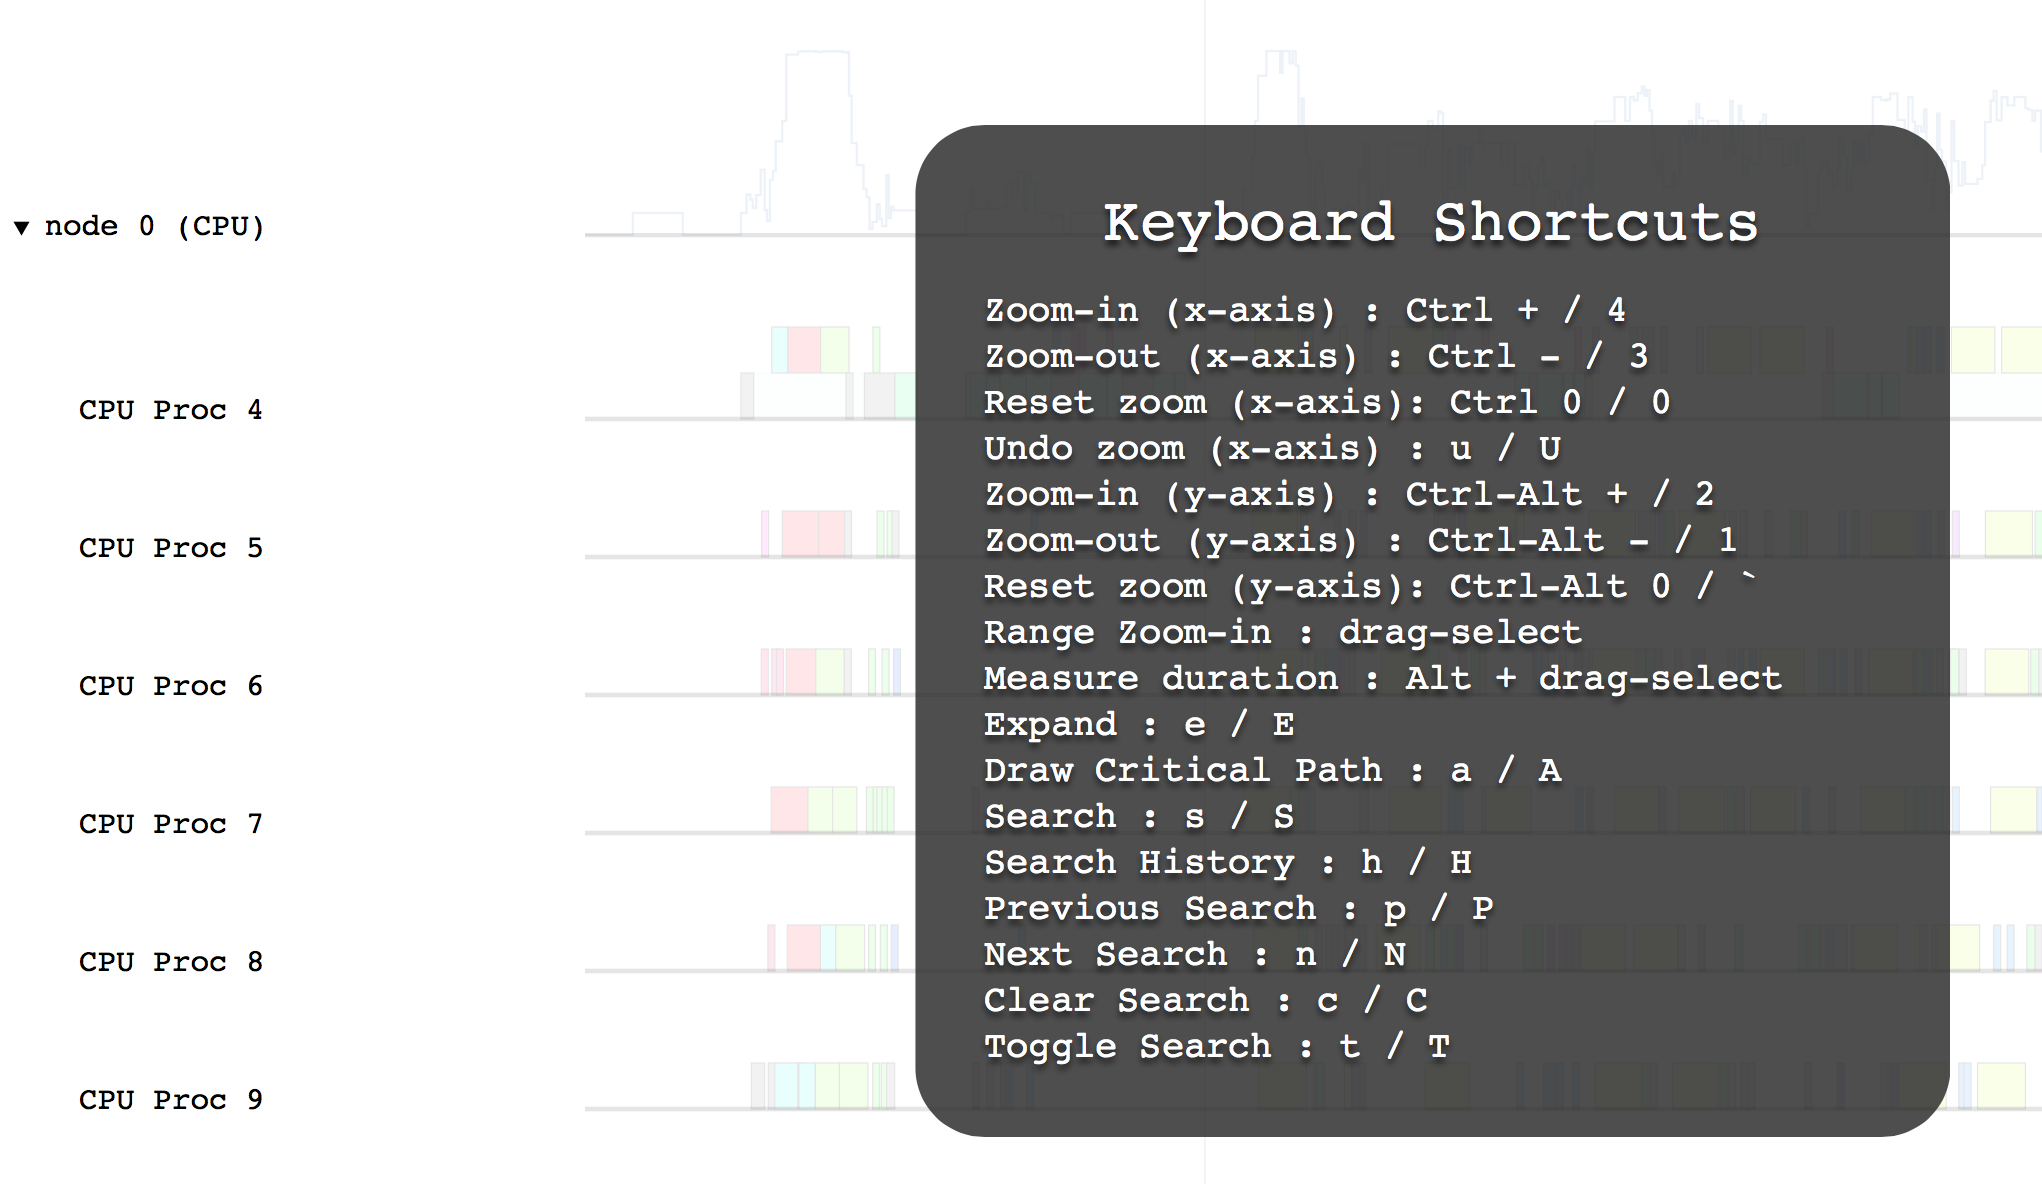
Press esc or ? to exit the help message.
One of the options in the help message was searching for tasks. To search for
a task, press s, type a search query, and press enter. Legion Prof will
highlight the matched tasks in red. To clear the search, press c.
Advanced Features
Legion Prof can interpret Legion Spy data to draw
dependencies between tasks. This can be helpful when debugging performance issues.
To take advantage of this feature, run your application with both Legion Prof and
Legion Spy logging enabled. Then pass both the Legion Prof
and Legion Spy traces to legion_prof.py.
DEBUG=0 make
./app -lg:prof <N> -lg:spy -logfile spy_%.log -lg:prof_logfile prof_%.gz
$LG_RT_DIR/../tools/legion_prof.py prof_*.gz spy_*.log
After Legion Prof creates the profile, you will be able to click on tasks that have dependency data. Left-clicking will draw solid lines to tasks that depend on the current task as well as from tasks that the current task depends on. Hovering over a line will show which way the dependency flows.
Similarly, right-clicking will draw the parent/child relationships for the current task.
You can deselect the current task by either clicking on a different task or left/right clicking on the current task to remove dependency and parent/child relationship lines, respectively.
Finally, pressing a will draw the critical path of dependencies in the
application. Inspecting this line can be helpful to determine where optimizations
should be made to improve the performance of the application. To remove the
critical path line, simply press a again.
General Optimization Techniques
In general there are three primary factors that contribute to the performance of a Legion application.
- Overall task and data movement throughput
- Latency of the critical path through the task/copy graph
- Runtime overhead
There are many variables which can impact each of these three performance metrics including the decisions made by the application mapper(s), the size and shape of the region trees, the selected regions and fields requested by tasks, and the settings of many of the variables specified on this page. The goal of performance profiling is to determine which variables are impacting performance and tune them for the best performance. Due to the large parameter spaces in Legion programs this is a difficult problem to solve in general. We therefore give some basic suggestions that we use when tuning Legion applications.
When tuning our Legion applications we usually make heavy use of Legion Prof to understand the costs of our mapping decisions and the performance of the runtime. A normal tuning cycle involves profiling the execution of our application, investing Legion Prof output to determine the most pressing bottlenecks, and then modifying the necessary parameters or Mapper implementations. Legion Prof time lines are the most common output that we investigate as they can show which processors are under-utilized as well as when there are bubbles in task execution. While this is useful, it doesn’t always suggest why there are bubbles. Legion Prof does not show data movement operations and therefore bubbles can be caused either by critical path dependencies, or by pending data movement operations. We currently rely on application specific information to discern the cause.
While the performance of the application is usually the limiter, it is also possible for runtime overhead to be a performance limiter. This most commonly manifests by seeing bubbles in processor executions. The real indicator is evident when looking at the runtime meta-tasks being run on the utility processors. If the runtime is not running sufficiently far ahead of the actual execution of the program, the IDs of the tasks being mapped will be in close proximity to the tasks being executed. If the runtime is running efficiently it will often be 10s to 100s of IDs in front of the actual execution.
Performance debugging, even in Legion, is still very much an art form and we are open to suggestions as to ways to improve it. We are open to suggestions about new tools to build to help with Legion debugging and are willing to place the appropriate logging calls in the Legion runtime, especially if users are interested in helping to write the post-processing and visualization tools. If you have suggestions, please post them to the mailing list.
Legion Configuration
Legion has a large number of flags that impact performance. These can be divided into two categories:
- Flags to configure the machine (number of CPUs, GPUs, memory sizes, etc.)
- Flags to configure internal runtime parameters (scheduling windows, etc.)
Machine Configuration
Legion provides a multitude of command line parameters which can be
used to specify the machine configuration that is made visible to an
application and its mapper through the Machine object. All these
flags are interpreted by the Realm low-level runtime and are therefore
prefixed with -ll:.
-ll:cpu <int>- Specify the number of latency optimizedProcessorsto allocate on each node. Typically this should be one or two less than the number of physical CPU cores available on a node. The default is 1.-ll:util <int>- Specify the number of utilityProcessorsto allocate on each node. Utility processors are used for performing runtime meta-tasks such as dependence analysis and mapping. More utility processors help reduce runtime overhead at the cost of consuming more hardware cores for meta-work. The default is 1.-ll:gpu <int>- Specify the number of GPUs on each node. This should be less than or equal to the number of discrete GPUs on the node. The default is 0.-ll:amsg <int>- Set the number of threads used for handling active message traffic between nodes. There must always be at least one of these threads. Applications which are very communication intensive may consider increasing the number of threads for handling active messages. The default value is 1. (Note: this flag is available with thegasnet1andmpinetworks only, and not available withgasnetex.)-ll:bgwork <int>- Specify the number of background threads. For applications which do significant movement of data between distinct memories, increasing the number of background threads can significantly improve performance. There must always be at least one background thread. The default value is 1.-ll:csize <int>- Set the amount of system memory per node available to the CPUs (e.g. DRAM) in MBs. In general this value should be less than the maximum amount of physical memory available on a node. If it is set larger, applications may end up thrashing virtual DRAM pages. The default is 512 MB.-ll:gsize <int>- Specify the amount of memory that should be allocated to the GASNet global memory in MB. The GASNet memory provides a globally visible memory across all nodes. This means that all nodes can read and write the GASNet memory but at the extreme cost of doing explicit RDMA reads and writes. The amount of GASNet memory divided by the total number of nodes must be less than or equal to the GASNet segment size (e.g. set by the environment variableGASNET_PHYSMEM_MAX). The default value is 256 MB.-ll:rsize <int>- Set the amount of GASNet registered memory in MB to be allocated on each node. Registered memory is pinned memory that is registered with GASNet so that it may used for doing one-sided RDMA operations. It is therefore especially useful for placing physical instances which are often communicated in these memories (e.g. ghost region instances). The maximum amount of registered memory must be less than GASNet segment size (controlled by theGASNET_PHYSMEM_MAXenvironment variable). The default value is 0.-ll:fsize <int>- Indicate the amount of memory in MB to be allocated for GPU’s framebuffer memory. This value is required to be less than the total amount of physical GDDR5 memory available in each GPU. The default is 256 MB.-ll:zsize <int>- Indicate the amount of zero-copy memory in MB to allocate on each node. Zero-copy memory is memory that is mapped into each GPUs address space as well as to CPU-side DRAM and is therefore accessible by all the CPUs and GPUs on the same node. However, it is very slow for GPUs to access because reads and writes must traverse the PCI-E bus. For more information on zero-copy memory we refer users here. The default value is 64 MB.-ll:stacksize <int>- Indicate the maximum stack size to allocate for each CPU thread in MB. By default the values is 2 MB (consistent with the Posix nominal value).-ll:sdpsize <int>- Set the maximum amount of pinned memory available for sending GASNet active messages on a node. Users should really only need to increase this value if they observe failures of theset_payloadruntime method. The default is 64 MB.-ll:lmbsize <int>- Indicate the maximum size of active messages that can be sent between a pair of nodes by fixing an upper bound on long message buffer (LMB) sizes in MB. Larger messages will get broken into chunks of at most this size. The default is 1 MB.-ll:numlmbs <int>- Set the maximum number of long message buffers that should be created between a pair of nodes. More buffers will increase the number of large active messages that can be in flight simultaneously, but at the cost of increasing pinned registered memory usage in the GASNet segment. The default is 2.-ll:pin <int>- Specify whether the CPU system memory allocated by the-ll:csizeflag should be pinned. Pinning the memory means that copies to and from the GPU can make use of the asynchronous DMA engines on the GPU. Note that pinning doesn’t register this memory with GASNet which distinguishes this memory from registered memory. The default value is 1 indicating true.
Legion Runtime Performance Flags
The Legion runtime itself also provides command-line flags for
controlling the execution of its out-of-order task processor. Not
surprisingly many of these flags are related to parameters which
are tuned by hardware architects in out-of-order processors. Since
Legion is built in software though, users have the direct ability
to tune these parameters to their particular application. In keeping
with the naming scheme used above, all Legion runtime flags
are prefixed by -lg:.
-lg:window- Specify the maximum number of operations that can be outstanding in a given task context (e.g. how many sub-tasks and operations can a task issue) before the task is stalled. This upper bound provides one way of applying back pressure on long running tasks and prevent them from running too far in advance. In many ways this value is analogous to the size of a re-order buffer (ROB) in hardware processors. The default value is 1024.-lg:sched- Set the maximum number of ready tasks which must be available to run on a low-level processor before the high-level runtime stops invoking the mapper to schedule more tasks. This controls how far in advance tasks are scheduled onto a processor. Note by Little’s Law, more tasks must be mapped to a processor if the tasks require longer to map. In many ways this value is analogous to the number of entries available at reservation stations for hardware resource units. The default value is 1.-lg:width- Indicate the number of operations which the high-level runtime should consider when making a scheduling pass. The wider this is, the more operations will be touched in a scheduling pass. This can increase throughput, but also increase latency of scheduling on processors. This value is analogous to the super-scalar width of modern processors. The default value is 4.-lg:message- Specify the maximum size of messages in bytes that can be sent between two instances of the high-level runtime. Smaller message sizes can decrease the latency of communication by pipelining communication, but can achieve lower interconnect bandwidth. Larger messages can achieve higher bandwidth, but at the cost of higher latency. The default value is 4096 bytes to ensure reasonable latency and bandwidth by ensuring medium size GASNet active messages are used on both Infiniband and Cray GASNet conduits.-lg:filter- This flag is more subtle and we only encourage users to make use of it after gaining some understanding of how the Legion runtime operates. In some application, there are many live operations that are non-interfering in different ways simultaneously. Since most non-interference tests end up failing, there is significant amounts of runtime analysis that is not useful. To help reduce this overhead, users can request that the list of users of physical instances be trimmed to some maximum size, possible in a way that reduces the precision of runtime analysis but not in a way that is unsound. By default this setting is disabled with the value 0. Reasonable values are usually in the range of 128 to 4096.