


Debugging
Legion provides robust support for debugging applications. The tools below fall into two categories: those intended for debugging applications, and those for debugging the runtime itself.
Generally speaking, users should start by trying these tools (typically in this order):
- Debug Mode (
DEBUG=1 make; ./app) - Backtrace (
LEGION_BACKTRACE=1 ./app) - Freeze On Error (
LEGION_FREEZE_ON_ERROR=1 ./app) - Privilege Checks (
CC_FLAGS=-DPRIVILEGE_CHECKS make; ./app) - Bounds Checks (
CC_FLAGS=-DBOUNDS_CHECKS make; ./app) - Partition Checks (
./app -lg:partcheck) - Legion Spy (
./app -lg:spy -logfile spy_%.log; tools/legion_spy.py -dez spy_*.log) - Mapper Logging Wrapper (
new LoggingWrapper(...)and-level mapper=2)
The following tools are typically used after the initial debugging tools have been exhausted or in special circumstances:
- Logging Infrastructure
- Debug Tasks
- Delay Start (
./app -lg:delay NwhereNis in seconds) - In-Order Execution (
./app -lg:inorder) - Full-Size Instances
- Separate Runtime Instances (
./app -lg:separate -ll:util 0) - Dump Backtraces (
./app -ll:force_kthreads) - Dump Events (
REALM_SHOW_EVENT_WAITERS=60+5) - Trace Memory Allocations (
CC_FLAGS=-DTRACE_ALLOCATION make; ./app -level allocation=2) - Legion GC (
CC_FLAGS=-DLEGION_GC make; ./app -level legion_gc=2 -logfile gc_%.log; tools/legion_gc.py -l gc_*.log)
Try These First
Debug Mode
For any Legion application that is not exhibiting expected
behavior, the first debugging technique should always be
to compile Legion in debug mode. If the
application is being built using our standard Makefile
infrastructure, this is done simply by setting DEBUG=1 in the environment or
at the top of the application’s Makefile. Compiling the
runtime in debug mode will enable many checks which are
disabled in release mode and may uncover both application
as well as runtime bugs.
A quick note on error messages: we endeavor to provide useful error messages, but Legion is still an experimental system and there may be assertions that do not produce useful error messages. If you encounter one of these assertions (regardless of whether it is an application or runtime bug), please report it on the bug tracker.
Backtrace
Legion can automatically print a backtrace when an error occurs (such
as an assertion failure or a segfault). This capability has a
negligible performance impact and is therefore recommended in settings
where crashes occur in production applications. Backtraces often
provide initial clues as to where a bug may be hiding, and can direct
further debugging efforts. To enable backtraces, set
LEGION_BACKTRACE to 1 in the environment:
LEGION_BACKTRACE=1 ./appWhen using mpirun as a launcher for the application, remember that a
-x flag is required to pass the variable to the child process:
mpirun -x LEGION_BACKTRACE=1 ./app(Note: LEGION_BACKTRACE can also be spelled REALM_BACKTRACE. Both
spellings are identical.)
Freeze On Error
Legion has the ability to freeze the application if it reaches an
error (such as an assertion failure or a segfault). This capability is
particularly useful in multi-node runs and in situations where the bug
might reproduce sporadically. To enable this, set
LEGION_FREEZE_ON_ERROR to 1 in the environment:
LEGION_FREEZE_ON_ERROR=1 ./appWhen using mpirun as a launcher for the application, remember that a
-x flag is required to pass the variable to the child process:
mpirun -x LEGION_FREEZE_ON_ERROR=1 ./app(Note: LEGION_FREEZE_ON_ERROR can also be spelled
REALM_FREEZE_ON_ERROR. Both spellings are identical.)
If the application crashes, it will freeze with an message such as the following. After logging in to the node, it should then be possible to attach to the process with a debugger. For example:
Process 12345 on node n0123 is frozen!

$ # logged in to n0123
$ gdb -p 12345
...

(gdb) info threads
  12   Thread 0x2b2220e33700 (LWP 2660) "terra" 0x00002b221c15fc6d in poll () at .../syscall-template.S:81
  ...
  4    Thread 0x2b2223fed700 (LWP 2668) "terra" 0x00002b221c1339bd in nanosleep () at .../syscall-template.S:81
  3    Thread 0x2b2223ff5700 (LWP 2669) "terra" pthread_cond_wait@@GLIBC_2.3.2 () at .../pthread_cond_wait.S:185
  2    Thread 0x2b2223ffd700 (LWP 2670) "terra" pthread_cond_wait@@GLIBC_2.3.2 () at .../pthread_cond_wait.S:185
* 1    Thread 0x2b221b23c480 (LWP 2651) "terra" pthread_cond_wait@@GLIBC_2.3.2 () at .../pthread_cond_wait.S:185
(As a hint, the offending thread is usually running nanosleep. Many
of the other threads are message handers and such and are not useful
for debugging purposes.)
(gdb) thread 4
(gdb) where
#0  0x00002b221c1339bd in nanosleep () at .../syscall-template.S:81
#1  0x00002b221c133854 in __sleep (seconds=0) at .../sleep.c:137
#2  0x00002b221e2e7246 in Realm::realm_freeze (signal=6) at .../legion/runtime/realm/runtime_impl.cc:85
#3  <signal handler called>
#4  0x00002b221c0a8bb9 in __GI_raise (sig=sig@entry=6) at .../raise.c:56
#5  0x00002b221c0abfc8 in __GI_abort () at abort.c:89
...
Privilege Checks
While Legion does have a type system capable of statically verifying that all region accesses abide by the stated privileges requested by a task, these guarantees are only available for applications written in Regent. For applications written in C++ that use the Legion runtime interface directly, we provide a way of dynamically verifying privileges on all memory accesses.
To enable privilege checks, the -DPRIVILEGE_CHECKS flag
should be added to the list of compile time flags specified
by the CC_FLAGS environment variable in Legion application
Makefile. This will enforce a privilege check for every
memory access done through a region accessor. If any privileges
violate the originally requested privileges for the task,
then a runtime error will be raised. Since this check is
performed on every memory access, it can significantly
degrade performance, but is very useful at finding privilege
violations that would traditionally be caught by the
Legion type system.
Bounds Checks
In addition to checking the privileges on all memory
accesses, we also provide a mechanism for verifying that
all memory accesses fall within the bounds of the logical
regions requested by a task. This feature is also used
to catch application bugs which would normally be caught
at compile-time by the Legion type system, but which may
escape detection when writing programs directly to the
runtime API. To enable these checks, the -DBOUNDS_CHECKS
flag should the added to the list of compile time flags
specified by the CC_FLAGS environment variable in a
Legion application Makefile. We again note that because
these checks are performed on every memory access, they
can significantly degrade the performance of a Legion
application.
Partition Checks
One of the more commonly occurring bugs in Legion applications
is creating partitions which an application declares to
be disjoint, but for which the provided coloring is not
actually disjoint. For performance reasons, when a call
to create_index_partition is made, Legion does NOT
check the declared disjointness of the coloring. Instead
the runtime simply trusts the applications to correctly
specify the disjointness of the partition. As users have
experimented with more complicated coloring schemes, we’ve
noticed an increasing number of cases where colorings are
claimed to be disjoint when they actually are not.
To address this problem, we provide the -lg:partcheck
command line flag which instructs the Legion high-level
runtime to verify the disjointness of all colorings which
are claimed to be disjoint and report a runtime error if
they are not. Depending on the size and type of coloring
as well as the number of colors, these checks can take
arbitrarily long and may degrade performance. Due to the
extreme performance cost associated with these checks, the
-lg:partcheck flag will issue a warning if it is used in conjuction
with profiling.
Legion Spy
Legion Spy is a visualization tool for task dependencies. This is useful for two reasons. First, visualizing dependendencies can help as a sanity check to confirm that Legion is recording the set of tasks and dependencies that the user expects. Second, Legion Spy contains a second implementation of the Legion dependence analysis algorithms, which it can cross-check against the captured dependencies to verify the runtime itself.
These modes have slightly different usage patterns, as a full check of the runtime analysis is relatively expensive.
To use visualize dependencies, run the application with -lg:spy
-logfile spy_%.log. (No special compile-time flags are necessary.)
This will produce one log file per node. Then run the post-processing
script legion_spy.py on the log files to generate PDF files of the
various visualizations in the current directory.
./app -lg:spy -logfile spy_%.log
legion/tools/legion_spy.py -dez spy_*.log
(The options used here are -d for dataflow graph, -e for event
graph, and -z to include more information, such as field names.)
To use Legion Spy’s full checking mode, compile with
CC_FLAGS=-DLEGION_SPY in the environment or at the top of the
application Makefile. Run the application as before, and call the
script with -lpa (-l for logical analysis, -p for physical, and
-a to assert on failure). (The options -dez will work as well.)
CC_FLAGS=-DLEGION_SPY make
./app -logfile spy_%.log
legion/tools/legion_spy.py -lpa spy_*.log
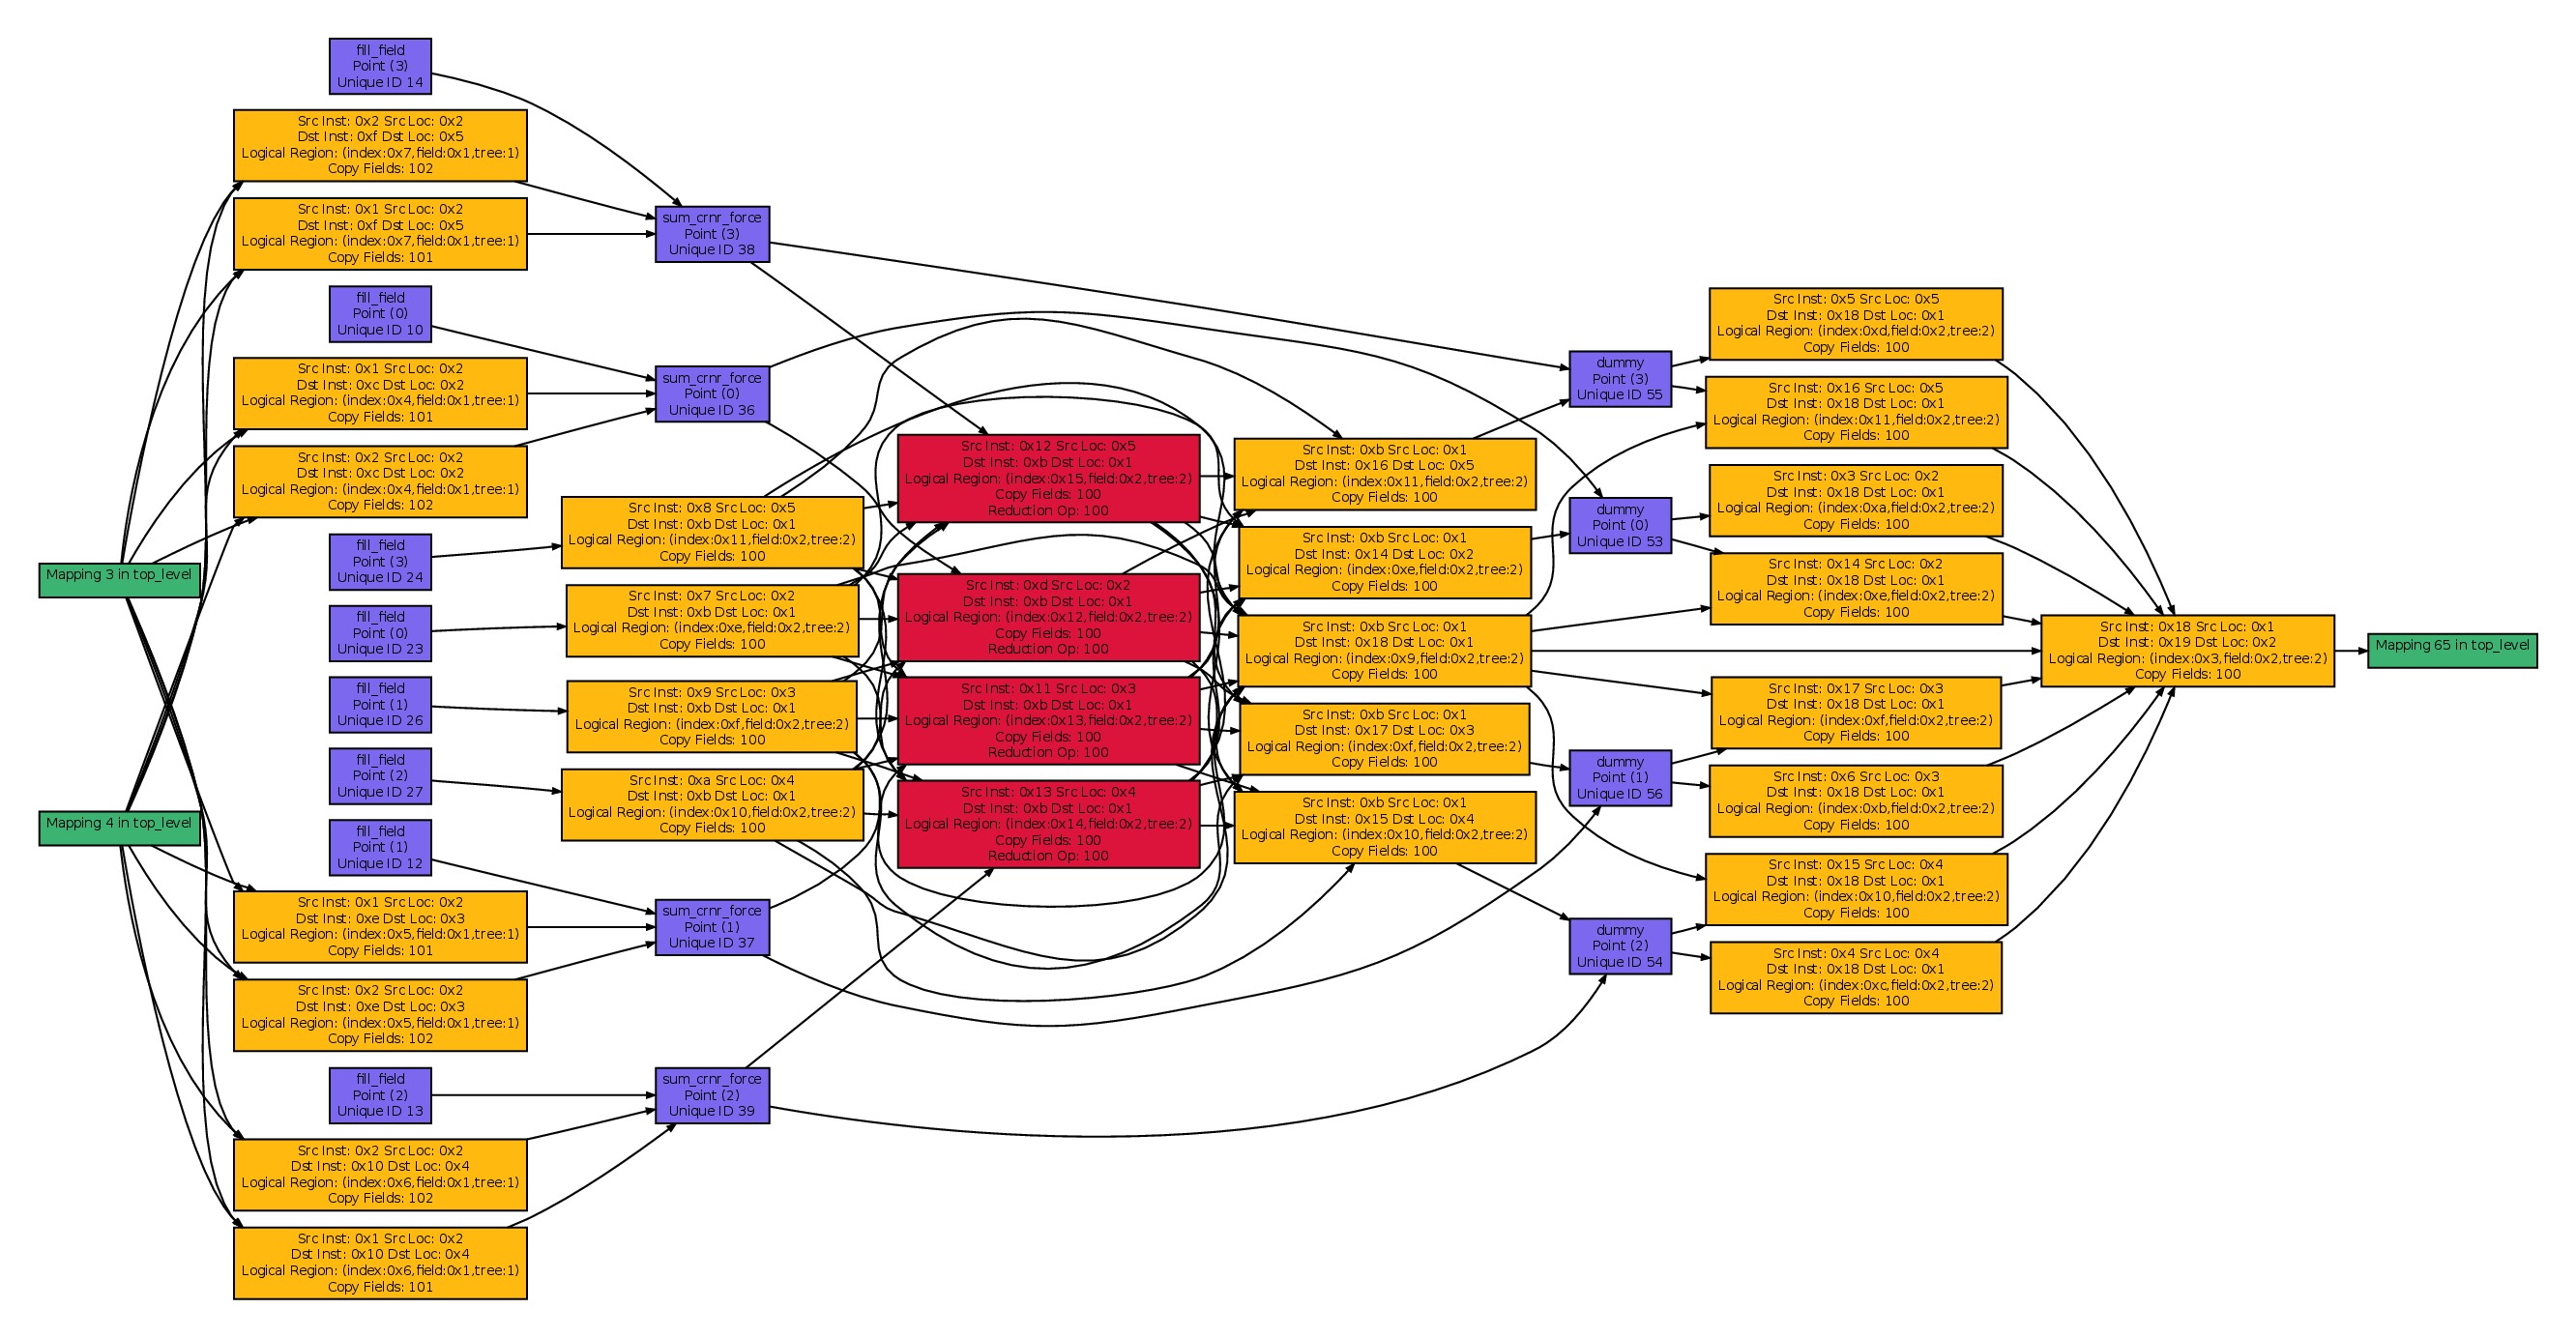
legion/tools/legion_spy.py -dez spy_*.logThe graph below is an example of the output generated by Legion Spy. Boxes correspond to different kinds of operations while edges represent explicit event dependences between the different operations.
Mapper Logging Wrapper
When your issue stems from tasks running on the wrong processor or
regions being instantiated in ways not suitable for your application
(e.g. a task’s input being placed on the wrong memory, or with the
wrong layout, or covering more of the index space than needed, or
having multiple copies when only one is needed) this is likely due to
the mapper making the wrong decision. You can confirm this by using
the LoggingWrapper class to record the decisions of the mapper,
and the characteristics of the PhysicalInstances it creates.
To use with your own mapper, include runtime/mappers/logging_wrapper.h,
replace any use of new MyMapper(...) in your code with
new LoggingWrapper(new MyMapper(...)) and run with -level mapper=2.
Enabling Realm-level instance reporting might also be useful (-level inst=1).
If you are not already using a custom mapper, you can define something like the following:
static void update_mappers(Machine machine, Runtime* rt,
                          const std::set<Processor>& local_procs) {
  rt->replace_default_mapper(new LoggingWrapper(new DefaultMapper(
    rt->get_mapper_runtime(), machine, *(local_procs.begin()))));
}
and invoke Runtime::add_registration_callback(update_mappers) at some
point before the runtime is started, e.g. in main right before calling
Runtime::start(...).
Other Debugging Options
Logging Infrastructure
Legion has a sophisticated logging infrastructure with support for
logging levels and categorization of messages. Logging is done using
static singleton objects called loggers. Each category of message is
declared as a static singleton object. For example, near the top of
the default mapper implementation in default_mapper.cc we create the
following logger category:
Logger::Category log_mapper("default_mapper");Loggers can be used in either printf style or C++ ostream style. The exact invocation depends on the desired logging level. For example:
// printf-style
log_mapper.warning("hello printf %e\n", 3.14);
// C++ ostream style
log_mapper.debug() << "hello ostream" << 3.14; // no endl
Legion supports six levels of logging (in order from lowest priority
to highest): spew, debug, info, print, warning, and error.
Message filtering of different levels is controlled simultaneously by
a static and a dynamic switch. First, the Makefile variable
OUTPUT_LEVEL places a static lower bound on which messages can be
emitted. Any messages below this level are guaranteed to be statically
elided by the compiler to avoid any runtime overhead. The logging
level can also be controlled dynamically by a command line
argument. Passing the -level [<category>=]<int> flag on the command
line will dynamically set the minimum (inclusive) logging level for
the specified category (or if omitted, all categories), with 0
corresponding to spew and 5 corresponding to error.
By default, logging messages are emitted to stderr. Often it is
desirable to log output to a file (or a file per node) instead. The
-logfile flag can be used to specify a filename for the logs. A %
character in the name (if any) will be replaced by the node number
(resulting in one log file per node).
For example, the command line below sets a logging level of 4 for
tasks, 2 for legion_spy, and 3 for everything else, and directs
output to a series of files prof_0.log, prof_1.log, etc. for each
node.
./app -level tasks=4,legion_spy=2,3 -logfile prof_%.logDebug Tasks
One very useful debugging technique that we have
found has been the ability to use debug tasks
as a means of introspecting Legion applications.
Due to the out-of-order nature of Legion task
execution, using a traditional debugger like gdb
to debug a single-node Legion application can be
challenging. To aid in setting break-points and
checking conditions in association with a debugger
we commonly inject explicit debug tasks which are
either empty tasks or tasks which do not impact
correctness and simply check for certain conditions
regarding the data in logical regions. One example of
a kind of debugging task can be seen in our
full circuit simulation
example which has optional checking tasks for
verifying that there are no NaN or Inf values
in our simulation.
Debug tasks are a very useful tool as they can request
their own privileges and logical regions for introspecting
all or a subset of an applications data. Similarly by
changing privileges and coherence modes, debug tasks
can control where they are run in the order of execution
of tasks. We routinely launch debug tasks which declare
stronger privileges than necessary (e.g. READ-WRITE
instead of READ-ONLY) in order to prevent any later
tasks from running in parallel.
In practice, the ability to launch debug tasks is one of
the most useful features of Legion, enabling introspection
that can be easily enabled and disabled without worrying
about correctness. Really, debug tasks are just a very
primitive form of in-situ analytics.
Delay Start
In some cases it can be useful to attach a debugger to a program prior
to the point where it actually fails. This can be challenging
particularly in multi-node executions where the user cannot simply run
gdb --args ./app .... To assist in such cases, Legion provides an
option to pause at the beginning of an application run. The user can
then use the delay to manually attach to the process with a debugger.
The following command will cause Legion to pause for 30 seconds prior to starting the top-level task:
./app -lg:delay 30The user can use this opportunity to find the appropriate PID and
attach with a debugger. For example, assuming that ps reports that
the PID is 12345:
ps -u $(whoami)
gdb -p 12345
After entering the debugger, the user can set breakpoints or configure
settings as appropriate, and then when ready can issue the command
continue to resume execution of the application.
In-Order Execution
While the goal of the Legion runtime is to implicitly
discover parallelism between tasks and other operations,
in many cases, when debugging a Legion application, it is
useful to know that operations are actually executed
in the order in which they are issued. This can be useful
both for debugging Legion application code, as well as
for investigating runtime bugs. To enable this feature,
execute the application with the command-line flag -lg:inorder.
When running
in this mode sub-tasks and other operations launched
within a parent task will be issued and run to completion
before the next operation is issued. This guarantees
that all operations are performed in program
order with no parallelism being extracted.
Full-Size Instances
Another useful debugging tool available is the ability to create full-size physical instances. In many cases, the Legion runtime only allocates space for the data requested by a task based on its logical region usage. If the requested logical regions are not the top-level logical regions in the region tree, the Legion runtime will trim the physical instances to only store the necessary data.
In the past, trimming physical instances has resulted in two kinds of bugs. First, applications which do not access data within the their logical region bounds (e.g. those that fail bounds checks), have caused random memory corruption by reading and writing in locations not actually intended. Second, trimming has in the past been a source of runtime bugs as it is difficult to ensure all the Legion copy routines properly recognized trimmed physical instances.
To help discover both types of bugs, the Legion
runtime can be compiled with the -DFULL_SIZE_INSTANCES
compile-time flag set in the CC_FLAGS of a
Legion application Makefile. This feature forces the
Legion runtime to always allocated physical instances
of the size of the top-level logical region in the
region tree. This prevents out-of-bounds memory accesses
from corrupting other instances and can aid in finding
runtime errors. If an application runs correctly
with -DFULL_SIZE_INSTANCES and passes all bounds
checks then it is likely a runtime bug and should
be reported on the
bug tracker.
Separate Runtime Instances
When debugging messaging protocols within the
Legion runtime, it can be challenging to
attach debuggers to processes on different
nodes. To make debugging these protocols simpler,
Legion supports a modified execution setup.
By default, there is only ever a single Legion
runtime instance per process (and by default
per node since we usually only launch a single
Legion process on each node). To support debugging
these messaging protocols on a single node, we
provide an execution setup where an instance
of the Legion runtime is created for each
individual processor in the machine. This
creates multiple instances of the Legion runtime
within a single process. Under this setting
messages are then used to communicate between
the different runtime instances (just as they
would be in the truly distributed case). This
allows a single debugger to be attached
to a process on a single node and observe
the different runtime instances. This setting
can be enabled by passing the flags -lg:separate -ll:util 0
on the command line. (The -ll:util 0 is required because this mode
does not support execution with explicit utility processors.)
Dump Backtraces
When debugging a freeze in Legion, the first step should always be to dump backtraces on all nodes. This will help determine (a) if the application is truly frozen or simply executing slowly, and (b) whether there are any obvious or unusual functions on the stack traces that may point to a possible cause.
One complicating factor is that Legion employs user-level threads by
default. Therefore, in order to get useful backtraces, it is necessary
to use the flag -ll:force_kthreads to disable user-level threads:
./app -ll:force_kthreads
# wait for the application to freeze
gdb -p 12345
thread apply all bt # inside gdb, dump backtraces
Note also that it is important to compile with debug symbols or else
line numbers will not appear in the resulting backtraces. This can be
accomplished by running in debug mode (which is
recommended anyway), or if the freeze does not reproduce in debug
mode, Legion can be compiled with -Og -ggdb or similar to ensure
that debug symbols are available.
Dump Events
When debugging a freeze, if dumping backtraces fails to provide insight, then it can be helpful to dump the Realm event graph to determine if a cycle has formed.
Realm can be configured to do this after a fixed delay. For example, if you observe that the application is reliably frozen after 60 seconds, then you can do:
REALM_SHOW_EVENT_WAITERS=60+5
./app
In a multi-node job, rank i will print its events at time
60+5i. This allows the printing to be staggered so that the results
do not get corrupted. Alternatively, one can use the job scheduler to
send stdout to a different file for each rank (e.g.,
--output events_%t.log in SLURM).
Dumping Events with a Debugger
There is an older method of dumping events which is no longer recommended in general, but has the advantage that it can be triggered interactively (so you can wait until the job actually freezes). This method is described below.
Note in order for this to work,
Legion must be compiled with debug symbols (-Og -ggdb or
similar). Debug mode is not required.
To dump the events, run the application and wait for it to
freeze. Then attach with a debugger and call the function
Realm::realm_show_events(0). The environment variable
REALM_SHOW_EVENT_FILENAME controls where the resulting log files are
stored.
Using gdb, this might look like:
export REALM_SHOW_EVENT_FILENAME=$PWD/events.txt
./app
# wait for the application to freeze
gdb -p 12345
call Realm::realm_show_events(0)
This should result in a file called events.txt. This file can be
processed by a Legion tool called detect_loops to look for cycles in
the event graph:
make -C legion/tools detect_loops
legion/tools/detect_loops event.txt
If a cycle is found it will be displayed on stdout.
Trace Memory Allocations
This is a tool for checking the number of internal Legion objects allocated over time, and their total memory usage.
CC_FLAGS=-DTRACE_ALLOCATION make
./app -level allocation=2
Legion will periodically print the total number of internal Legion objects that have been allocated, their total memory usage, and the difference (in number and size) compared to the last snapshot.
Legion GC
This is a tool for checking for application leaks of Legion API objects or handles.
CC_FLAGS=-DLEGION_GC make
./app -level legion_gc=2 -logfile gc_%.log
legion/tools/legion_gc.py -l gc_*.log
This tool will print a message if any objects are leaked by the application.